
Introduction
Fluorescent microscopy techniques rely on the fact that molecules of interest fluoresce or can be made to fluoresce. Most proteins of interest require a fluorescent tag, as intrinsically fluorescent POIs are rare and the exception to this rule. A fluorescent signal allows a protein’s precise location to be determined as well as its behavior to be observed. This can then be studied in relation to other fluorescently tagged proteins. In this way, researchers are able to use fluorescence microscopy to visualize underlying biological processes.
Proteins can be labeled in a variety of ways, such as with other proteins (specifically fluorescent proteins) or by using artificial dye molecules. However, depending on spatial restrictions, some of these methods can be more beneficial than others. Sometimes, protein epitopes are not accessible by larger structures, or environmental conditions, such as pH, can restrict the use of a technique. This document explains the most common protein labeling techniques, gives advice for selecting the best fluorophores for a range of samples and examines how camera choice can help overcome some fluorophore weaknesses.
Considerations For Labeling
In general, two common approaches are used for protein labeling:
- Direct labeling: Fluorophore attached directly to a protein or encoded with the same gene as the protein
- Indirect labeling: Fluorophore connected to a protein via a linker structure
When using these labeling techniques there are three important criteria of the fluorescent label to consider that determine the final resolution and accuracy with which a structure can be described, location of label, photostability, and location of protein.
Location of label: The location of the fluorescent label on the protein is critically important when doing direct labeling. While the size of a dye molecule is largely irrelevant as it is typically a fraction of a nanometer (nm), the real problem arises from the way the dye molecule is targeted to the protein, it must be targeted in a way that does not affect the activity of the protein by occupying active sites or interfering with the protein function.
Photostability: Fluorescent proteins are usually dimmer (lower quantum yield), bleach quicker and have slower blinking kinetics than organic dye molecules. The blinking frequency and the number of blinking cycles a molecule can undergo, as well as the ability to be pushed easily into the dark triplet state and be reactivated, is important for techniques such as STORM and PALM. Fluorescent proteins may manage to undergo 10-100s of cycles whereas organic dyes can blink 1000s of times before breaking down and being permanently bleached. STORM and PALM super-resolution microscopy crucially rely on the number of emitted photons and the ability of the dye molecule to blink, therefore organic dyes are preferred.
Location of protein: Surface proteins can be easily labeled with antibodies, but it is more challenging when labels need to cross the plasma membrane of a cell in order to access proteins within the cell. To enable the labeling of intracellular structures and compartments, cells need to be permeabilized, i.e. the plasma membrane is made to no longer function as a barrier between extra- and intracellular space. As a consequence, cells will die quickly when permeabilization is performed live, which in turn requires the cell to be fixed. Fixation, usually performed by fixatives (organic solvents, cross-linkers), kills cells and arrest them at a certain time point which prevents the researcher from performing any dynamic measurement.
Methods Of Labeling Proteins
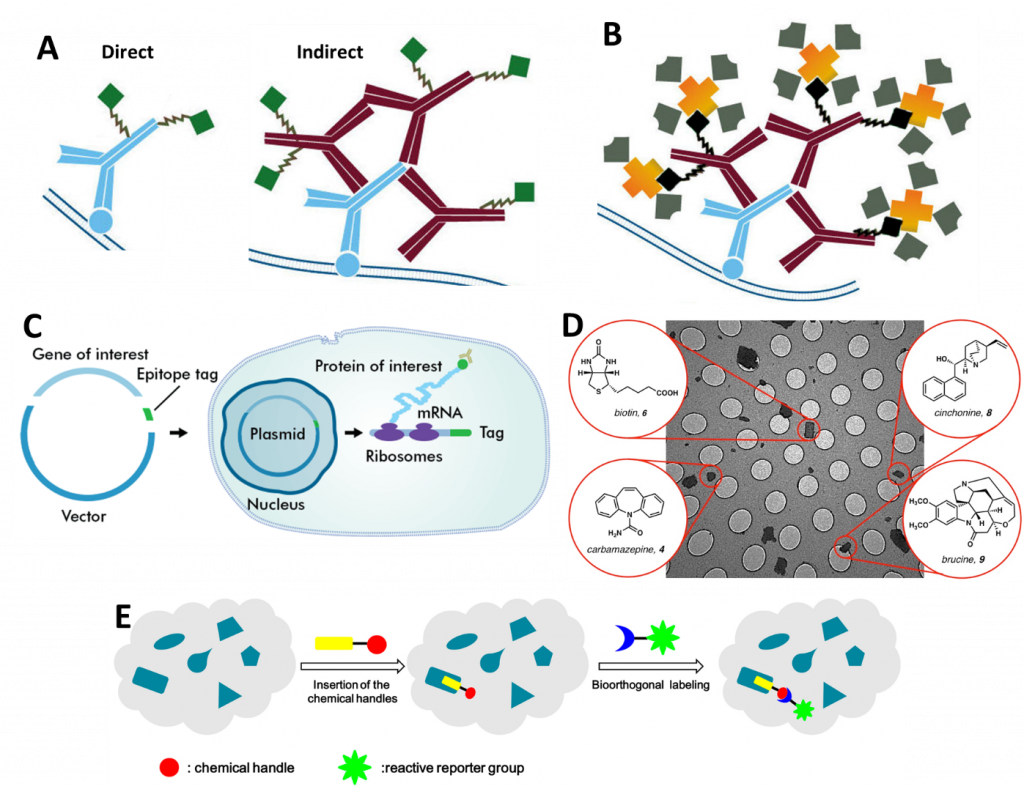
There are a number of different methods with which to fluorescently label proteins for single molecule microscopy studies. A summary of popular methods can be seen in Fig.1, which outlines antibodies, biotinylation, epitope tags, small molecule markers, and bioorthogonal labeling.
Antibodies
Antibodies are proteins and are part of the immune system. They help to identify intruders, such as bacteria and viruses. Each antibody uniquely recognizes a specific antigen structure (i.e. an epitope such as proteins/polysaccharides) on its matching target. The enormous specificity arises from the antibody detecting the matching epitope.
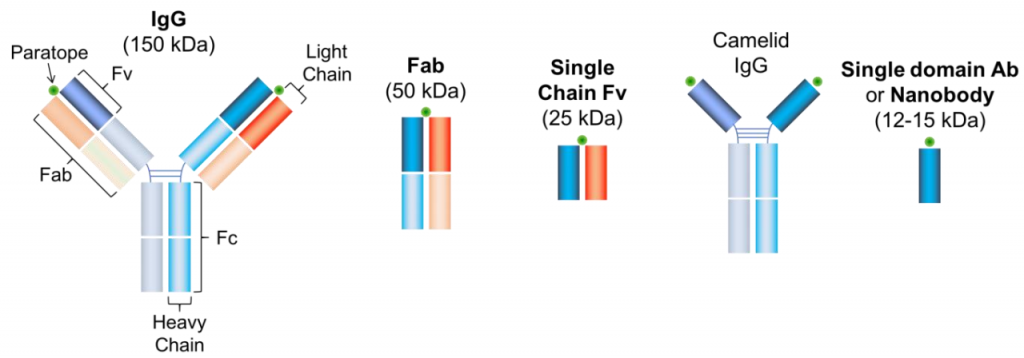
The most commonly applied method of antibody labeling is by using an unlabeled primary antibody to target a protein of choice and then targeting a fluorescently labeled secondary antibody to the primary antibody (seen in Fig.1A and Fig.2). Considering the structure of a conventional antibody – consisting of 2 heavy chains and 2 light chains – is roughly 10 nm in length, this will add a fluorescent structure 20 nm away from the actual location of the protein.
A polyclonal antibody (a mixture of antibodies recognizing various antigens on the same target structure) will recognize multiple sites on a protein. This will add further uncertainty to the determined position. A monoclonal antibody (one identical antibody species only detecting one target structure) will decrease the likelihood of this as the position is far more predictable. Nevertheless, secondary antibodies are usually polyclonal to enhance the signal and increase the number of localization events per structure. The fact that this adds uncertainty is usually ignored as the number of photons is more important – although this depends on the detection system and its sensitivity.
To get the fluorophore closer to the protein of interest, a labeled primary antibody is a good option. This is called direct immunostaining. Nevertheless, it takes away the flexibility to change the fluorophore of choice and to adapt to various imaging modalities. It also is more expensive.
It is possible to get the fluorophore closer to the POI by using only the labeled Fab-fragment (the part of the antibody which contains one light chain, half a heavy chain, and only one paratope, see Fig.2) as it is only half of the size of a single antibody (5 nm). The benefit of this approach is the improved specificity of the fragment as it only consists of a single domain and potential crosslinking as thereby prevented. Moreover, smaller antibodies can bind much easier to otherwise inaccessible protein domains. If the Fab-fragment is still too large, a labeled Fv-domain can be used. The Fv-domain consists only of the antigen-recognition site of a Fab-fragment and roughly halves the size again (see Fig.2). It retains the benefits of the Fab-fragment in terms of specificity and crosslinking. As a valid alternative, antibodies can be produced in species that consist only of 2 heavy chains (Heavy chain antibodies, e.g. camelids, sharks, crocodiles). If this is still too big, the heavy-chain antibody can be modified to function as a nanobody. The nanobody consists of a labeled single Fv domain, is less than a tenth of the size of a conventional antibody (12-15 kDa) and is therefore only a couple of nanometers long.
One issue to keep in mind when using antibodies is that they cannot move across cell membranes. Therefore, cells must be permeabilized before labeling can begin, which usually means they are dead, and hence live-cell imaging is not possible. Antibodies are a popular choice when combined with cell fixation.
Biotinylation
Biotinylation involves covalently binding biotin to a protein of interest, nucleic acid or another molecule. Biotin has very high-affinity interaction partners in avidin and streptavidin (seen in Fig.1B) as well as highly specific antibodies. Avidin and streptavidin can then be modified to express a fluorescent tag. In contrast to some other techniques, biotinylation seems not to interfere with the underlying physiological processes enabling live-cell imaging. To avoid aggregation/clustering of biotinylated targets, monovalent streptavidin can be used.
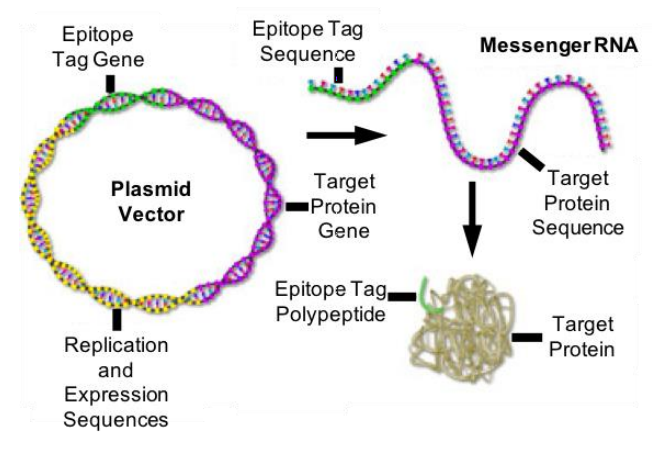
Epitope Tags
Epitope tags (Figure 3) can be an option if no good antibody is available for immunofluorescence labeling of the protein of interest. Those epitope tags can be expressed as a fusion construct – genetically encoded and directly attached to the protein of interest. The short epitope tags can then be labeled by commercially-available high-affinity antibodies.
Examples of epitope tags include:
- Flag-tag (sequence – DYKDDDDK): First epitope tag to be published and is patented by Sigma-Aldrich. A designed peptide.
- HA-tag (sequence – YPYDVPDYA): Fragment 108-106 of human influenza hemagglutinin, which is the antigenic glycoprotein responsible for the binding of flu virus to the surface of cells.
- V5-tag (sequence – GKPIPNPLLGLDST): Derived from a small epitope present on the P and V proteins of simian virus 5 (SV5).
- Myc-tag (sequence – EQKLISEEDL): Fragment of the myc transcription factor and proto-oncogene.
The epitope tag needs to be at an exposed position at the protein of interest, which sometimes can be tricky to achieve and requires careful design. It may also have an unlikely, but possible negative side-effect on the functionality of the protein of interest.
Small Molecule Probes
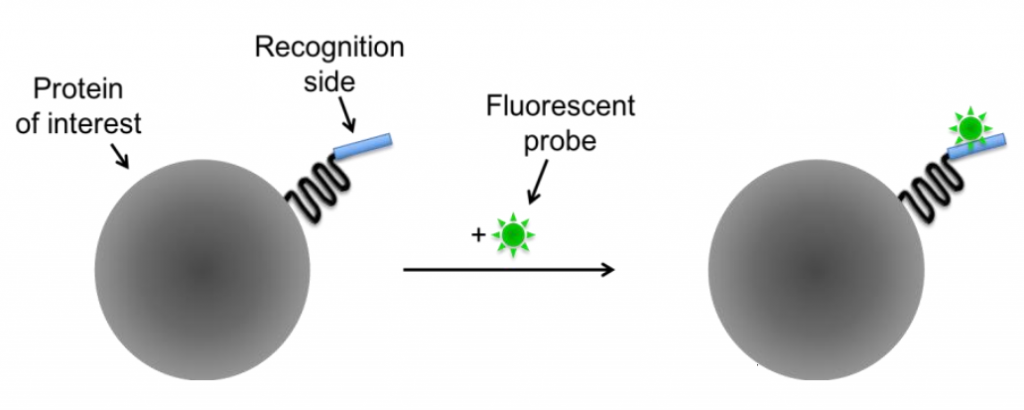
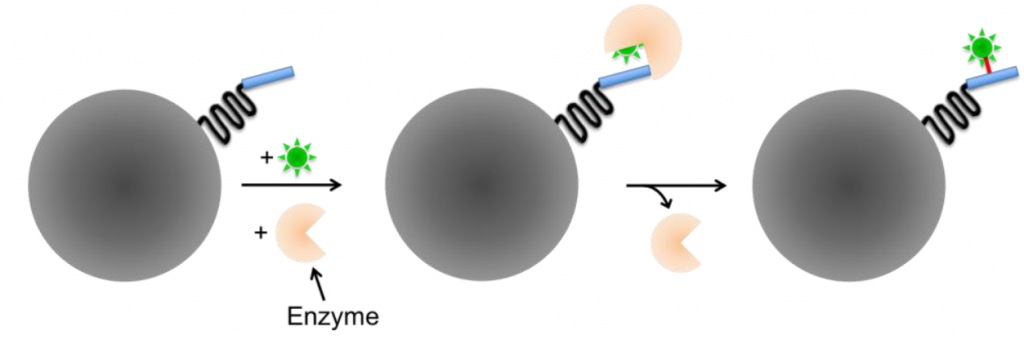
By fusing the protein of interest with a recognition site (such as a non-fluorescent protein or molecule), fluorescent probes can bind to these recognition sites and confer fluorescence to the protein. There are two classes of small molecule probes: self-labeling (Fig.4) and enzyme-mediated (Fig.X).
Self-labeling is based on the very high affinity and specificity of the involved reagents and can be used if an antibody for the protein of interest isn’t available. The protein gets modified by attaching an additional recognition site which is accessible for a fluorescent probe, as seen in Fig.4.
Some specific examples are FlAsH and ReAsH, these are membrane-permeable molecular dyes and can be used with live cells, as opposed to antibodies where the cells require permeabilization. These dyes are initially non-fluorescent, but upon binding to the recognition site on the protein (in this case a tetracysteine tag of CCXXCC) they become fluorescent. This allows for very specific fluorescent labeling of modified proteins in live cells.
One issue with these tags is non-specific binding, certain cycteine-rich proteins can cause high levels of background fluorescence and bury the intended signal.
Other examples of self-labeling small molecule probes are:
- HaloTag, a membrane-permeable hydrolase that comes with options for the fluorophore characteristics
- SNAP-tag, a mutant DNA repair enzyme that binds irreversibly to a synthetic probe
- CLIP-tag, a modified version of SNAP-tag that recognizes a different linker
Enzyme-mediated labeling requires the presence of an enzyme to covalently bind to the reactive group to the linker. Enzyme-mediated tags are typically smaller than self-labeling tags but require an additional enzyme to catalyze the labeling step, and often involve substrates that are not membrane-permeable and therefore can’t be used for intracellular proteins or live-cell imaging.
Some examples include tags based on the acyl carrier protein (ACP), such as ACP- and MCP-tags. The specificity of these tags is based on the enzyme, as fluorescently-conjugated substrates can label both the ACP- and MCP-tags. ACP-synthase specifically targets ACP-tags, but a synthetic SFP-synthase can target both ACP- and MCP-tags, making the enzyme type of vital importance for the specificity of fluorescent labeling with enzyme-mediated small-molecule probes.
For dual-color labeling sequential incubation is required, with the hope that all reaction sides were labeled with the first step, otherwise, false-positives can be observed after the second incubation.
Bioorthogonal Labeling
To avoid interfering with the cell’s metabolism, researchers have developed a method that circumvents direct crossreaction with physiological processes by stepping into the word of bioorthology (seen in Fig.1E and Fig.6). Bioorthogonal reactions occur between two functional groups that do not react with biological molecules, but selectively react with each other e.g. tetrazines and strained alkenes/alkynes. To enable a protein of choice to be useful for bioorthogonal labeling techniques, genetic code expansion is required. Genetic reprogramming facilitates the site-specific incorporation of unnatural amino acids bearing bioorthogonal functional groups into proteins in bacteria, mammalian cells, and animals.
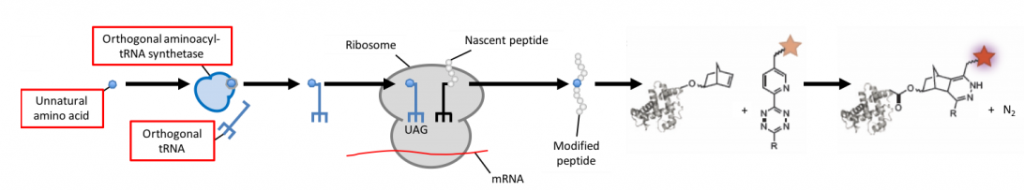
Incorporating an unnatural amino acid requires an orthogonal aminoacyl-tRNA synthetase/tRNA pair. Attaching a tetrazine linker to fluorophores quenches their fluorescence prior to labeling with the unnatural amino acid, thereby reducing background fluorescence. As with fluorescent proteins, protein expression can be tightly controlled by regulating amino acid availability. If no unnatural amino acid is fed to the cell, no tagged protein will be produced and hence won’t interfere with the cell’s metabolism.
Fluorescent Labels
The methods mentioned above detail how a protein of interest can be detected, but labeling always requires the presence of a fluorescent probe. Throughout the last century, various methods have been developed to highlight structures for microscopy techniques. Of particular interest are labels which can easily be detected by the eye, but, more recently, by sensitive detection devices such as scientific cameras.
Most of the fluorescent dyes used in microscopy have certain wanted and unwanted characteristics. Usually, they get excited by a lower wavelength (higher energy light), get elevated from a ground state to an excited state and – while falling back to the ground state – emit photons of a longer wavelength (lower energy light). This, in turn, can be detected by suitable devices with the help of optics suited to the label of choice. Various labels will be discussed below, and the advantages and disadvantages briefly described.
Organic Dyes
Organic dyes are a traditional fluorophore used by biologists for decades, featuring good photostability and brightness. However, they require cell fixation and permeabilization as they are often paired with non-membrane-permeable antibodies, so they have limited use in live-cell studies.
- FITC/TRITC: fluorescein isothiocyanate (FITC, green fluorescence) and tetramethylrhodamine isothiocyanate (TRITC, red fluorescence) are among the first reported fluorescent organic dyes. They are excited by short-wavelength light and emit longer-wavelength light, attributed to their aromatic (circular) electron structures. Over time, FITC and TRITC have been out-performed by more modern dyes.
- Cyanines: the Cy family (Cy2, Cy3, Cy5, Cy7) can be linked to nucleic acids or proteins via their reactive groups. Cy5 is sensitive to its electronic surroundings, which can be utilized for enzyme measurement. Conformational changes in the labeled protein can lead to positive/negative alternations in the fluorescence emission, allowing further analysis. However, cyanine dyes are out-performed in terms of brightness, photostability, and quantum yield.
- Alexa Fluor: Alexa dyes are sulfonated forms of different fluorescent substances like fluorescein, rhodamine, and cyanine. They were invented by Molecular Probes, the Alexa series provide the largest commercially-available spectral variety. Alexa molecules are negatively-charged, hydrophilic, and are named after their specific excitation wavelength, such as Alexa Fluor 488 being excited by 488 nm light. Alexa dyes trump other dye types in photostability, brightness and pH sensitivity.
Quantum Dots
Quantum dots are nanoparticles (particles a few nanometers in size) consisting of a heavy metal core coated with various layers of shielding to protect the cell from the detrimental effects of the heavy metal. The surface can be functionalized easily to recognize, for example, antibodies or streptavidin. Quantum dots present an alternative to fluorescent dyes and proteins, displaying a much brighter signal and being very photostable (Fig.8).
The initial size of quantum dots varies between 5 and 10 nm, which is of crucial importance as the size determines the emission characteristics of the quantum dots. They feature a large absorption range but very narrow emission spectra, which makes them ideal for multiplexing. A positive side effect of the heavy metal core is that quantum dots are also ideal for correlative fluorescence and electron microscopy.
The functionalization potentially increases the size of quantum dots significantly. This can consequently restrict access to smaller compartments and structures and gives the labeled molecules a tendency to aggregate. Furthermore, quantum dots can blink which might be an undesired effect but might actually be useful for localization-based super-resolution techniques such as STORM.
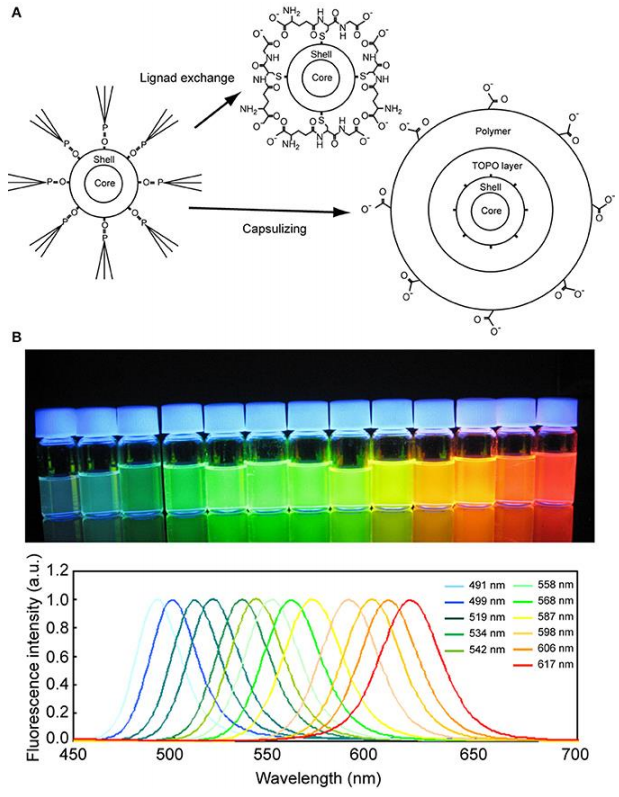
quantum dot. (B) Fluorescence photograph (upper) and spectra (lower) of quantum dots of various diameters. The quantum dots were excited by a UV light of 365 nm wavelength. Image from Ichimura et al. (2014).
Fluorescent Proteins
Aside from the development of antibodies for use in research, the utilization of fluorescent proteins in the late 1970s was one of the biggest breakthroughs in science. Fluorescent proteins are very small and highly specific, as they can be genetically incorporated into a protein of interest. This means that one protein of interest is labeled by one fluorescent protein – a perfect ratio (although in some cases tandem/tandem-dimer variants can be used to increase the brightness). This, in turn, is a good predictor of individual fluorophores’ behavior.
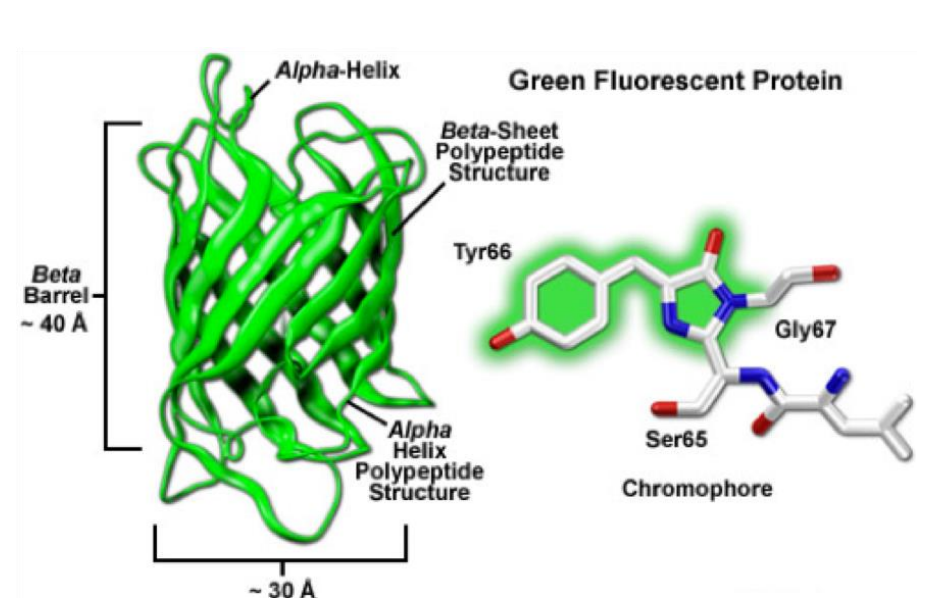
The targeted protein of choice can either be labeled by overexpression of a fusion-construct or production of a transgenic cell-line/animal. The result does, under normal circumstances and careful planning, not interfere with the physiological function of the used organism. The very first fluorescent proteins being reported was the “green fluorescent protein” (GFP, Fig.9) in 1962 by Osamu Shimomura. GFP is derived from Aequorea victoria, a jellyfish found in the Pacific Ocean. GFP emits green light (ca. 525 nm) when excited with blue light (ca. 490nm). Additionally, fluorescent proteins have a size benefit as green fluorescent protein is less than 3 nm.
The basic structure of a fluorescent protein consists of a chromophore that is embedded in a beta-barrel, which protects the chromophore reasonably well from certain negative effectors such as low/high pH which will alter the characteristics of the specific fluorescent protein. Various discoveries, modifications, and optimizations have led to variants that display different spectral properties (throughout the entire visual spectrum), show higher photostability, are brighter and monomeric.
Selecting The Right Camera
Observing fluorescently-labeled structures in fixed and living samples is the essence of modern biological science. With fixed samples, there is usually no limit to the number of photons that can be harvested from individual structures of interest as those are labeled with a very high abundance of antibodies or with bright dye molecules. Researchers can benefit from a large field of views available from state-of-the-art scientific CMOS cameras allowing them to increase their sample throughput massively. The use of lower magnification lenses with high numerical apertures is also beneficial and in consequence, would require cameras with smaller pixels to allow for Nyquist sampling. Imaging live samples with high light levels risks altering the behavior of the structure of interest, resulting in less physiological data. Therefore, it is crucial to use imaging devices that detect the maximum number of photons emitted from the structure with as little excitation light as possible. This requires a camera with high sensitivity, particularly at the wavelength of interest. Higher sensitivity also allows for lower exposure times to be used to increase imaging speed and, therefore, observation of true physiological processes.
Summary
Selecting the correct labeling technique crucially determines the outcome of an experiment. In particular, when it comes to the location/precision of the label in relation to the protein of interest. However, the choice can be further complicated by the limited accessibility of the structure of interest. The options for the label offer as wide of a range as the labeling techniques themselves. The number of photons emitted, the spectral response, overall characteristics (blinking, cycle time, quantum yield, sensitivity to the environment, etc.), all features have to be carefully considered.
Download As PDF
References
Bates, M., Huang, B., Dempsey, G. T. & Zhuang, X. (2007) Multicolor super-resolution imaging with photo-switchable fluorescent probes. Science. Sep 21;317(5845):1749-53.
Davis, L. & Chin, J. W. (2012) Designer proteins: applications of genetic code expansion in cell biology. Nat Rev Mol Cell Biol. Feb 15;13(3):168-82. doi: 10.1038/nrm3286
Fernández-Suárez, M. & Ting, A. Y. (2008) Fluorescent probes for super-resolution imaging in living cells. Nat Rev Mol Cell Biol. Dec;9(12):929-43. doi: 10.1038/nrm2531.
Heilemann, M., van de Linde, S., Mukherjee, A. & Sauer, M. (2009) Super-resolution imaging with small organic fluorophores. Angew Chem Int Ed Engl. 48(37):6903-8. doi: 10.1002/anie.200902073.
Ishikawa-Ankerhold, H. C., Ankerhold, R. & Drummen, G. P. (2012) Advanced fluorescence microscopy techniques– FRAP, FLIP, FLAP, FRET and FLIM. Molecules. Apr 2;17(4):4047-132. doi: 10.3390/molecules17044047
Ichimura, T., Jin, T., Fujita, H., Higuchi, H. & Watanabe, T. M. (2014) Nano-scale measurement of biomolecules by optical microscopy and semiconductor nanoparticles. Front Physiol. Jul 29;5:273. doi: 10.3389/fphys.2014.00273
Romanini, D. W. & Cornish, V. W. (2012) Protein labelling: Playing tag with proteins. Nat Chem. Mar 22;4(4):248-50. doi: 10.1038/nchem.1325.
Stennett, E. M., Ciuba, M. A. & Levitus, M. (2014) Photophysical processes in single molecule organic fluorescent probes. Chem Soc Rev. Feb 21;43(4):1057-75. doi: 10.1039/c3cs60211g.
Tschesche, H. (2011) Methods in Protein Biochemistry. De Gruyter. ISBN-10: 9783110481501, ISBN-13: 978- 3110481501