
Introduction
One of the goals of biological microscopy is to observe and analyze biological processes and structures on the subcellular scale. However, the size of the smallest structures that can be observed is set by the diffraction limit of light, meaning no detail can be resolved smaller than around 250 nm. Overcoming this barrier is one of the most active subjects of investigation in modern microscopy and as a result, there are many techniques for super-resolution microscopy.
Many of these techniques require lengthy multi-frame acquisitions (such as PALM/STORM/DNA-PAINT) or rastering of high powered lasers (STED), meaning they require significant post-processing and are largely unsuitable for imaging live cells.
Structured Illumination Microscopy (SIM) and the high-speed alternative instant SIM (iSIM), can halve the resolution limit of conventional light microscopy. However, unlike other super-resolution methods, iSIM can capture images at up to 100Hz, and with a greater degree of optical sectioning (rejection of out-of-focus light). This enables iSIM to generate 3D + time super-resolved images deep into biological structures, all while using conventional fluorescent dyes and molecules. This opens up the possibility of observing sub-diffraction limited dynamic processes within cells and tissues that may previously not have been possible to visualize.
SIM and iSIM both work off the concept of using structured patterns of light, with SIM making use of a Moiré pattern caused by the interference between two different patterns at an angle.
Moiré Patterns
SIM relies upon a known phenomenon, where overlaying two large-scale patterns can produce a different pattern through interference. These interference patterns are termed Moiré patterns (after the French word for cotton/silk fibers with a distinct pattern), further demonstrated in Fig.1.
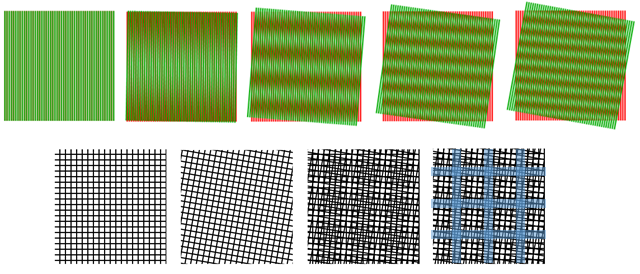
As Fig.1 shows, two patterns with high spatial frequency can combine into an interference Moiré pattern with a lower spatial frequency (which still contains information about the two higher frequency grids). This concept is used as the basis for SIM.
Structured Illumination Microscopy (SIM)
The ability of SIM to achieve its resolution increase relies on the principle of Moiré patterns – an effect frequently utilized for optical illusions.
How Moiré patterns can be used to reveal information of a higher spatial frequency can be seen from Fig.1. As the two fine (high spatial frequency) grids are overlaid in the rightmost image, the interference reveals a grid of a larger size (lower spatial frequency), that contains information about the two smaller grids.
By applying illumination patterned with lines of sinusoidally-varying brightness, structures in the sample interfere with the grid and reveal additional spatial information. Through acquiring multiple images, shifting and rotating that pattern to cover every visible area of the sample, a single super-resolution image can be reconstructed, achieving double the spatial resolution that the optical system is capable of.
This process is understandably slow as it requires the digital combination and summation of multiple images, but it is considerably faster than super-resolution localization microscopy techniques such as PALM and STORM. Changes to SIM can increase the speed, however, creating instant SIM or iSIM.
Instant SIM
iSIM allows for even greater speed increases, on the order of 100x better time resolution than PALM/STORM (hundreds of frames a second). When considering the addition of processing time, acquisitions can be created on the order of 10,000 times faster. iSIM also allows for 10x deeper sample penetration compared to other SIM-based approaches, and with better optical sectioning than a spinning disk confocal.
iSIM achieves this by building on multifocal SIM (mSIM), a technique that combines pinhole-based optical sectioning and structured illumination to create a confocal super-resolved image. Rather a structured light grid, iSIM uses multiple small points of light that are scanned over the sample, similar to a spinning disk confocal microscope. Instead of performing the combination and summation of multiple images digitally, iSIM achieves its speed by performing this summation optically through the use of micro-optics arrays and galvo-scanning mirrors, this is far faster and also reduces camera noise. An outline of the mechanisms behind iSIM can be seen in Fig.2.
As the pattern of focused points of light scans across the sample, the emission light is also scanned across the camera, meaning that the image is built up simultaneously and the acquisition of a final image is much faster than SIM.
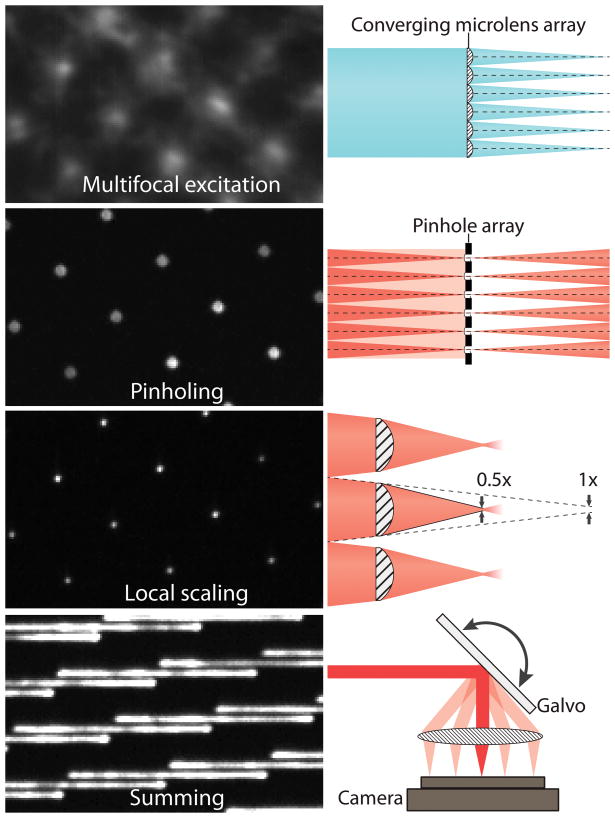
The focal points are formed with microlenses and are combined with the use of pinholes on the emission path which provide optical sectioning (rejection of out of focus light). Next, a microlens array provides 2x optical contraction of the image from each illumination focus point individually. To image the entire sample, a galvanometric mirror translates the excitation pattern across the sample.
Where iSIM differs from its predecessor mSIM is that the summing of images from multiple mirror positions is done optically rather than in software, improving speed and reducing the contribution of camera noise. As the pattern scans across the sample the emission light is simultaneously translated across the camera and due to the ongoing exposure of the camera during scanning, it effectively sums the contributions from the points along the scan.
The final step is to perform deconvolution on the acquired image to reduce the contribution of the point spread function (PSF) of the optical system. Deconvolution is very powerful with iSIM, due to the small PSF and good optical sectioning. This leads to an overall 2x increase in resolution.
The process of building an iSIM system is thoroughly detailed in Curd et al., 2015.
iSIM Applications
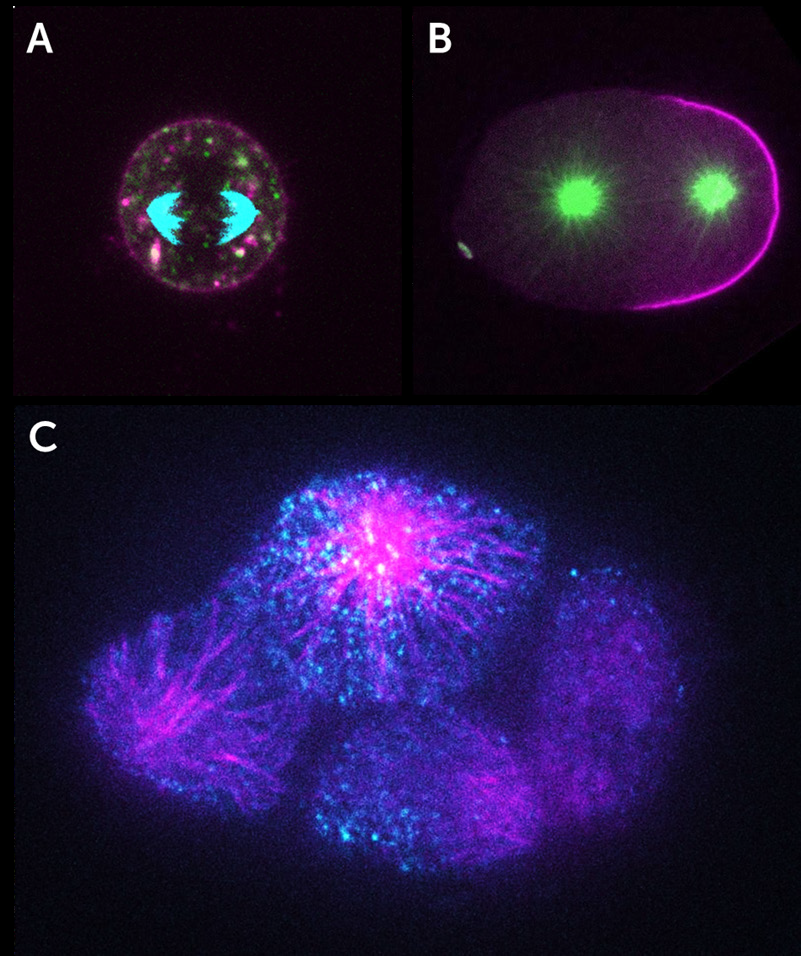
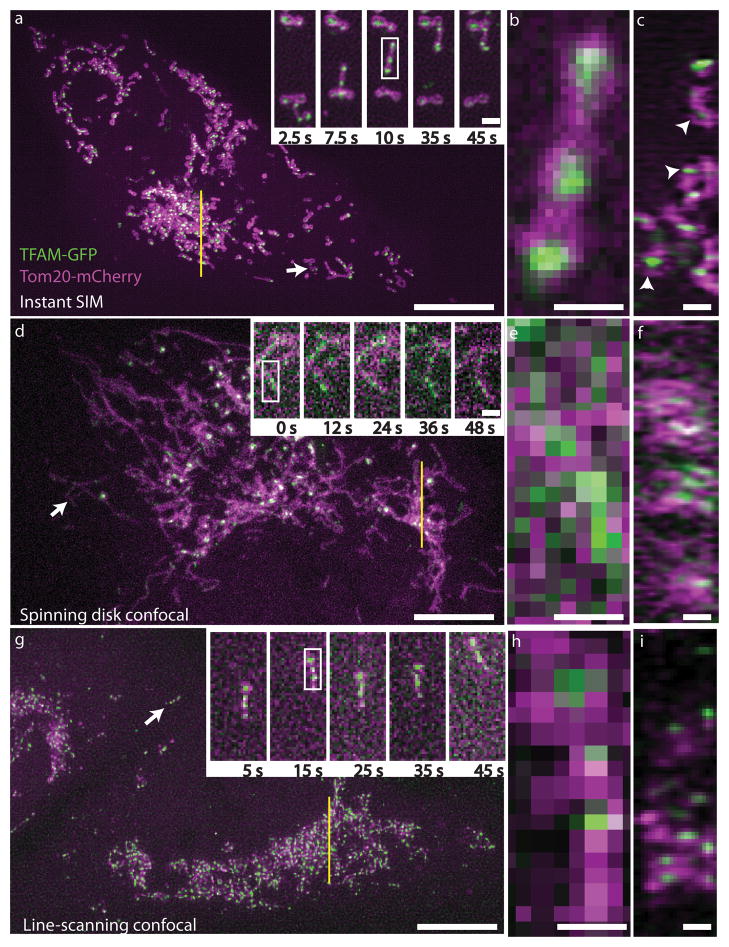
As iSIM can image at super-resolution levels very quickly and perform optical sectioning, it is possible to take 3D images of the interior of cells and other biological samples. This leads to some impressive images that are packed with information, as seen in the three examples below (all from York et al. 2013) where iSIM has been used to image mitochondria (Fig.3) and endoplasmic reticulum (Fig.4) within live human lung cells, and image red blood cells within the blood vessels of live zebrafish (Fig.5).
Fig.3 demonstrates the power of iSIM by showing comparisons between iSIM, standard spinning disk confocal microscopy and line-scanning confocal microscopy. This difference is particularly clear at higher magnifications (Fig.3B,E,H).
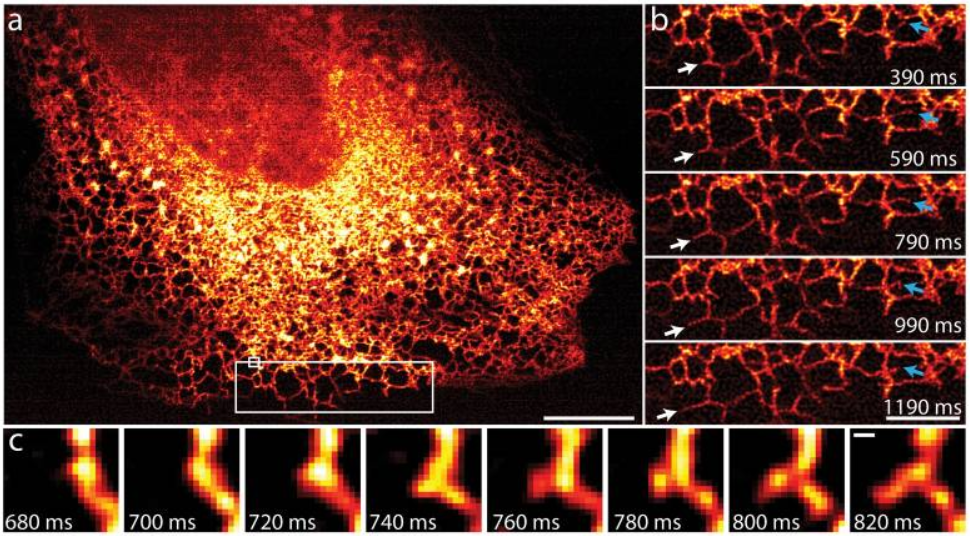
The endoplasmic reticulum (ER) moves and grows very rapidly, with the formation and growth of new ER tubules occurring on timescales of the order of 100 ms, which would be blurred with other SIM implementations, yet not resolvable spatially without a super-resolution technique. Fig.4 shows that iSIM is capable of capturing this challenging phenomenon very clearly.
iSIM was also successfully used to resolve the structures of red blood cells moving with the blood vessels of a living 3- day-old zebrafish, without motion blur. Fig.5 demonstrates the capability of iSIM to image moving structures noninvasively within living subjects.

Cameras for SIM and iSIM
SIM and iSIM are well suited to the large field of view, high speed and smaller pixels present on sCMOS devices which excel at imaging live cells at high spatial and temporal resolutions.
Back-illuminated CMOS cameras should also be a strong consideration as they provide the extra sensitivity necessary to lower exposure times and thereby increase acquisition speed. The clean, pattern-free backgrounds present on back-illuminated CMOS cameras are also of great value for SIM and iSIM which rely on creating patterns to achieve superresolution imaging.
References
Curd, A., Cleasby, A., Makowska, K., York, A., Shroff, H., & Peckham, M. (2015). Construction of an instant structured illumination microscope. Methods, 88, 37–47. https://doi.org/10.1016/j.ymeth.2015.07.012
York, A. G., Chandris, P., Nogare, D. D., Head, J., Wawrzusin, P., Fischer, R. S., … Shroff, H. (2013). Instant superresolution imaging in live cells and embryos via analog image processing. Nature Methods, 10(11), 1122–1126. https://doi.org/10.1038/nmeth.2687